An effective Gantt chart in project management
Once, I participated in a big project of building an Accounting Shared Services Centre for one of the largest Polish companies. The complexity of the project required the establishment of several project teams that were involved in accounting processes, site preparation and equipment, IT and HR. In total, about 50 people participated in the project!
Project planning took several weeks and at some point we were all invited to a meeting where the Project Manager presented the project plan in the form of a Gantt chart. It was printed with a special plotter and hung on a map rack. It looked like a large map of Poland hanging on a metal hanger in a school geography classroom.
The Project Manager was proud of his piece of work, and none of the attendees had ever seen a bigger project plan before. Initial enthusiasm and pride in the complexity of the Gantt chart were quickly replaced by problems in its use for effective project management.
Since then, many years have passed during which I had the opportunity to manage at least a dozen large projects – such as building IT systems, designing strategies for large companies, projects to optimise business processes, designing and implementing methodologies and systems to manage controlling projects in large capital groups, etc. Based on my own experience, and analysis of books, expert studies and articles I have read, I draw the following conclusions regarding the effectiveness of using the Gantt chart in project management.
Gantt Chart in project management – key tips
1. BEFORE YOU BEGIN TO CREATE A GANTT CHART, MAKE SURE YOU HAVE A CLEAR UNDERSTANDING OF THE OBJECTIVE, SCOPE, AND OUTCOMES OR, IN OTHER WORDS, PRODUCTS OF THE PROJECT.
If you look at different project teams, you can notice that they often start building a project plan/ schedule in the form of a Gantt chart without a thorough understanding of what the final project should deliver.
However, it is possible to build a Gantt chart that is “good-looking” but is poor in terms of content. It has defined tasks, milestones, links between tasks, assigned responsibility, etc. – it looks professional. However, the problem is that:
- it is difficult to verify whether all tasks shown in the schedule are needed,
- it is hard to confirm whether it covers all the tasks needed to achieve the project objective.
Foggy target hampers navigation; it is not clear. The same is true of the project. It is impossible to create a good Gantt chart if the objective of the project is blurry. The problem is that project teams do not fully realise this and start implementing a project with such a schedule.
For example, it may prove relatively quickly that the schedule has to be modified because after the first Business Project Review, the project sponsor or the management find out that their idea was slightly different and they are beginning to articulate it. Then the project manager and their team update the Gantt chart, and it will likely turn out part of the work has been in vain. As a result, we have used our resources to perform unnecessary tasks, which means that we have incurred pointless costs, we may have delayed the project and, worse still, the team is less motivated.
It seems that we could have easily avoided it by giving more time at the outset to define and understand the objective and scope of the project well. The magic question, which solves many problems, is rarely asked. It is the question: “What does not belong in the project?”. It is often easier to understand what is the scope of the project when you discuss what is not part of it. Now imagine the process of updating the “huge” Gantt chart hanging on the rack, reprinting it – a lot of frustrating and unnecessary work – and that is not the way forward.
2. THE GANTT CHART IS USED TO MANAGE THE PROJECT PLAN. IT SHOULD BE LEGIBLE AND SHOULD NOT SHOW INDIVIDUAL OPERATIONS OR SMALL TASKS.
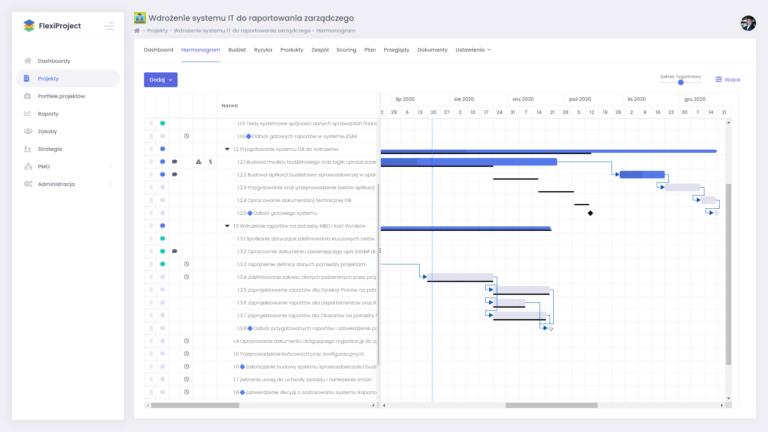
Let us return briefly to the example given at the beginning of the article. The “huge” Gantt chart, hung on the map rack, is simply impractical. It is too complex to use it for project management. It is so because the Project Manager assumed that if Gantt shows all, even tiny, tasks, it will be more precise and effective.
In practice, the effect is quite the opposite. Such a schedule will require permanent changes. It will be difficult to track the status of individual tasks. It will soon become dead weight rather than a tool that helps successfully complete the project. The alternative is to build the Gantt chart, which focuses on “large” tasks, while the so-called subtasks or individual activities are in the main task details – the Gantt chart does not show them. The advantage of such an approach is the high legibility of the schedule, which consequently requires less substantial changes and thus is a more stable roadmap for the project.
In addition, you prepare the so-called baseline and monitor deviations that are visible to the sponsor, other stakeholders, project manager and task owner only for critical tasks. It is at the level of critical tasks that a regular discussion is held on the state of the project, its problems and the required decisions. As for the subtasks or operations, they are defined by task owners and assigned to different team members. In this way, the task owner becomes a “mini” project manager and manages, depending on the scale of the task, a “mini” project team. This approach works in practice.
3. USE A GOOD IT TOOL TO CREATE A PROFESSIONAL GANTT CHART.
It is the year 2020 and we are all surrounded by IT applications designed for different purposes. This is also the case with the tools to develop a Gantt chart – perhaps there are not as many of them as personal time and budget management applications, but there are some – better or worse. Many project managers build a simple Gantt chart using MS Excel. Some companies add a large amount of VBA code to Excel and achieve fairly decent results. However, compared to professional software developed using advanced technologies, they are much weaker and less functional solutions.
https://flexiproject.pl/en/Besides Excel, it seems that the best suited tools in which project teams develop the Gantt chart are, for example, MS Project and FlexiProject. At the same time, they are better integrated with other aspects of project management, such as Project Charter, project budget, risks, comments and discussions in working teams.